


Breakout or Bust?
Testing Returns After Bollinger Band Breaks


Setting the Table:
As the market marches unflinchingly upwards, we continue our analysis of momentum. This week saw more active trading that we’d expect from a mid-week holiday, with healthy turnover and breadth. Yesterday 61M contracts traded - the highest since March 8th!
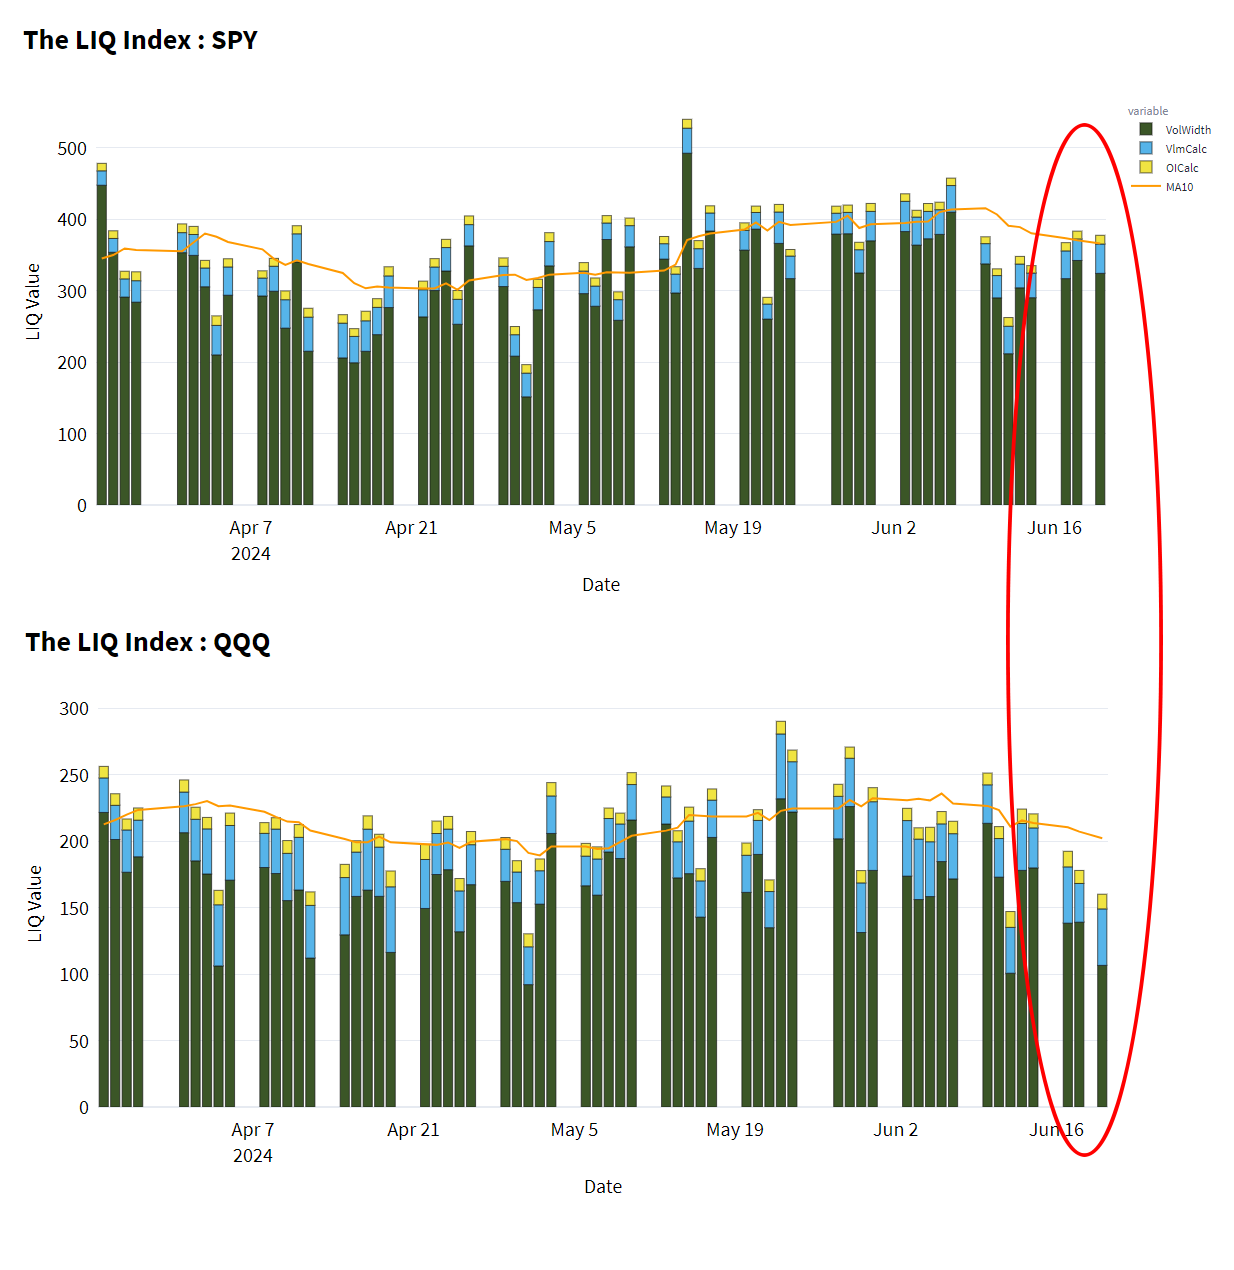
LIQ however has been lagging in both SPY and QQQ, as steady volumes don’t compete with widening markets. The holiday week isn’t going to help market widths, and wariness does creep in as implied vol can move quickly off the lows.
One of the most difficult times for dealers may be when movements are placid and inputs have not changed for a while. Even on lower volume, variation provides opportunities to trade around, and means market makers can provide better overall markets.
We can see some of these trends visually. Highlighted in orange, the ATMVol30 has been lingering in a tight range for SPY. Further, we see a narrowing range of historical vol versus implied vol in the red triangle.
A dealer’s objective is to collect theoretical edge and trade around moving inputs, not guess where they’re going. The biggest risk is when those inputs move fast, and a directional position accrues. Prices in underlying and vol space tend to snap off extremes (high or low), so extra padding might be added (i.e. market width) when things feel “coiled”.


Identify:
Our lens for covered call and hedged equity trades this week has been to use Bollinger Bands as indicators for breakouts or reversions. While I don’t put a lot of faith in most technical indicators - I believe price incorporates its past history according to weak forms of the efficient market hypothesis - the simple statistical technique is useful to describe relative price action.
As with all indicators and perspectives on the markets - these signals should be used in concert with other fundamental and options pricing analysis, with respect to your objectives.
Data points say “hey, LOOK at this”, not “hey, DO this.”
Depending on your perspective, a stock trading near its upper bands may be poised for a breakout, or settling back into its prior range. Compare against premium capture, risk profiles, and overall liquidity to determine the texture of a trade.
With covered calls, we saw strong momentum signals for both MSFT and IREN. MSFT had a deep liquidity profile, while IRENs vol indicators were notable.
Covered Calls: MSFT vs. IREN
·
Setting the Table: The market is sitting at all time highs and we’re headed into a broken up holiday week. There’s no better recipe for a standstill in volatility markets. Thirty day ATM vol is testing the lower limits with a slow steady grind higher in the underlying.

For hedged equity, in both CAVA and JNJ we discussed how strike listings impact adjustments to the GULL structure and the different trade offs.
Hedged Equity: JNJ vs. CAVA
·
Setting the Table: Momentum continues to drive the market to all time highs as the S&P notched its 30th top of the calendar year. The NDX is up just under 10% in June and we’re barely halfway done. The tricky thing about playing this scenario is it always lasts longer than you feel like it should, yet the turn around also catches you by surprise.

So in this context - does hitting a Bollinger Band have any statistical significance? Is there a difference between individual equities and indices? What about liquidity, does that matter?
Keep reading with a 7-day free trial
Subscribe to Portfolio Design with TheTape to keep reading this post and get 7 days of free access to the full post archives.