


Hedged Equity: JNJ vs. CAVA
Adjusting the GULL structure for different use cases.


Setting the Table:
Momentum continues to drive the market to all time highs as the S&P notched its 30th top of the calendar year. The NDX is up just under 10% in June and we’re barely halfway done. The tricky thing about playing this scenario is it always lasts longer than you feel like it should, yet the turn around also catches you by surprise.
Hedged equity is an interesting alternative in this market, and can be adjusted based on personal preferences and the environment. Our GULL indicators typically look at the 5/20% out of the money put spread, but this can be tweaked in both moneyness and overall protection dimensions (e.g. the 3/15% or 10/30%).
Volumes are beguiling, as they can come when you least expect it. While we thought this holiday week would be slow, the last few days have been a paradigm shift from the first part of June. Over 50M the last three days is 15% above long term averages.


Programming Note: Portfolio Design will be off next week, but TheTape.Report never sleeps. Stay up to date on market movements and run screeners on live data.
To celebrate the first week of summer, take $100 off a subscription to TheTape. Our Analyst package includes Expensive Calls and Puts, the Screener and Strip.
Still not sure? At DemoTheTape.com you can get a preview of all the Analyst reports, without logging in or signing up.
Follow along here, as we dissect the various opportunities our screeners present. Learn how to identify, analyze, and execute on different types of investments and trades. A paid subscription gets you access to all the screener data, along with an additional trading opportunity analysis every edition. Plus - weekly research on market structure and trade implementation.
Yikes: GME
This is not the first or last time we’ll see GME as a great example of indicators gone wild. On the screen it says the 90 day GULL is trading at about 131%, but reality is even crazier. Since the closest expiration is 121 days out, the cash neutral call on a 20% OTM put spread is more than triple the stock price at $80.

This is a perfect example of why we want to adjust the strikes. Only getting protection between $20-$24 seems almost superfluous, and is a barely different profile than owning the stock.

If we get aggressive with the puts, and cover between 10-50% (23/13 put spread) down, there’s still the potential for stock to increase 80%.


Investment: JNJ
In a stock market dominated by momentum, it’s always important to see the names that have been left behind, and the Bolly indicators can be flipped upside down to see those at the bottom of their bands.
JNJ has had a bumpy year (-10%), but as the rest of the market has rallied, the stock price has stabilized. Amongst the names that are sitting at lows, what distinguishes JNJ for a fundamental trade is the tight VRP and IVNet figures, low relative implied volatility, and a healthy dividend yield.
The low and stable volatility figures are important for a longer term position, as this suggests efficient pricing, letting the options sculpt your position.

We also see this in the LIQ index here, where spread widths make up a material part of the score, and reflect markets less than a vol point wide.

A GULL reading of 7% might not be the most exciting on the board, but does allow for some upside rebound in a defensive position.
The catch here, is the strike selection. Out 90 days we’re looking at only $5 strikes, and that means the actual customization is fairly limited. The choices are .60%/4%/7.5% OTM.
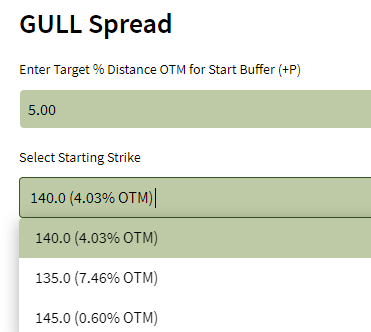
Dollar strikes are listed in closer expirations, so there may be the possibility to tweak this trade as we get closer to settlement.


Keep reading with a 7-day free trial
Subscribe to Portfolio Design with TheTape to keep reading this post and get 7 days of free access to the full post archives.