


The Effects of Tighter Spreads
Market impact of spread width, and how it relates to VRP


Setting the Table:
Indices continue to sit near all time highs as volatility and volume sag together. Yesterday was the first day all week we broke 40M options traded, in a relatively disappointing head fake for bears.
Condors in SPY are at their low for the year. Both ATM and wing vol are lower with overall tension and jump risk both softening.

An interesting comparison point is the end of March, just before April showers doused the broad market. Condor levels were about 2bps higher (i.e. the same), but skew looked different.
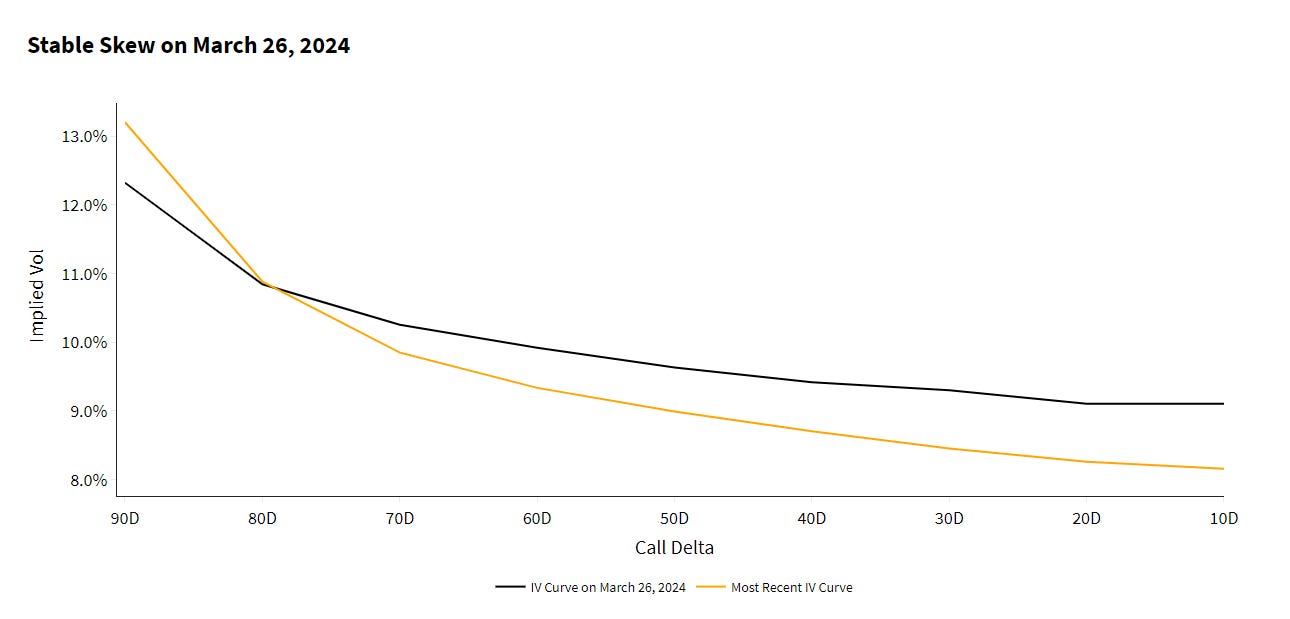
The curve in yellow today is steeper for 30 day options in SPY, but mostly because the call side has dropped out. Downside implied vol is even higher at the extreme wings.
Equity prices might be marginally higher, but there’s less enthusiasm about more to come.
Last week we pointed out how this rally has been on lower liquidity than we typically see - yesterday was the first sign of a turn around. QQQ posted its fourth highest LIQ score of the year. The largest three were back in January and February.

This was somewhat buoyed by volume, but we can see that spread widths tightened significantly.
Volumes have been slightly lighter, but wider spread widths are the real contributor to lower LIQ scores this year. VolWidth (Blue) is the implied volatility width of markets, and a component of the LIQ score (Red). Bid ask differential is trending down far faster than the overall score. Yesterday’s activity was a notable exception.


Identify:
The width of the markets is an important factor in measuring liquidity. While size also matters, for most intents and purposes the top of book is a solid indicator of where you can expect to get executed as a customer. It’s where wholesalers get measured on their wheel performance up to 250 lots.
Dealers set quote widths as a confidence interval. The more certain they are of pricing, the less cushion they need to add. Higher confidence in volatility comes from continued orderflow, but also relationships across time, strike, and recent pricing dynamics. After a surprise move, confidence and width scores go down.
Width is measured in implied volatility terms, because we can normalize that across all issues, and across dollar prices within issues. If SPY is 9.5% vol bid at 9.7% vol offered, those 20 basis points are comparable to a TSLA market of
Last week we investigated the relationship between volume, liquidity, and price changes. Today, we’ll analyze the other component of the LIQ index - market width - and how that impacts price changes in covered calls and cash puts. We’ll also test if market width is related VRP; is dealer confidence warranted?
Keep reading with a 7-day free trial
Subscribe to Portfolio Design with TheTape to keep reading this post and get 7 days of free access to the full post archives.