


Volume Pockets
How trading activity impacts the pricing of overlays


Setting the Table:
Equity markets have hardly taken a breather over the last two weeks as both the NDX and the SPX sit within a tick of their all time highs. A little stickiness in inflation is no longer a concern to investors, the power of that narrative is waning.
One interesting aspect of this rally, has been that liquidity hasn’t been rebounding alongside underlyings. Spread widths in particular have not been tightening (Wednesday being the exception).
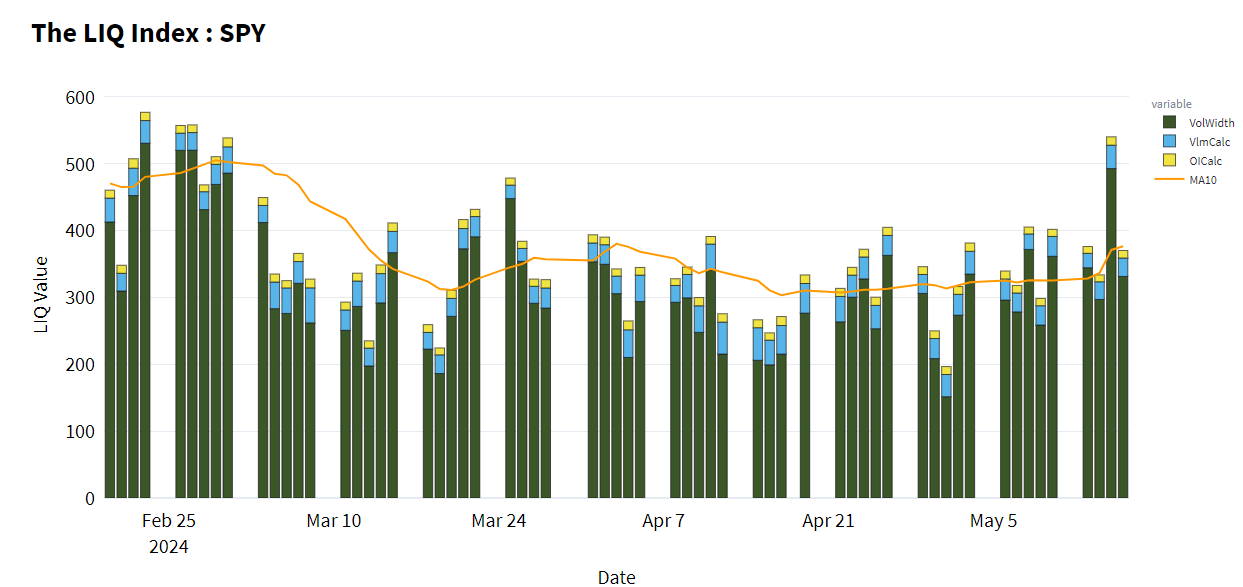
Zooming out further, we see a secular downtrend in LIQ for SPY. (This is true across other otherliers - check out TheTape.Report.)
We’re in the same volatility environment, just with significantly lower liquidity. There are structural reasons like minimum tick increments that might be at play on the margin, but volatility denominated widths are notably higher at the same implied vol levels.

We can point to spread widths here, because the other main component of liquidity is volume, and while turnover might be slightly more variable recently, trading activity more constant than LIQ would imply.


Identify
Volume and spread width are the two core components of the LIQ calculation. More volume tends to bring about tighter spreads, but that phenomenon only persists over time. Initially more volume can overwhelm a market, and cause significant shifts.
The tightness of spreads comes because dealers (who are at the top of the quote most of the time) expect volume to persist over time, providing offsetting flow and opportunities to manage the position. Activity which swamps the order book is likely to move inputs.
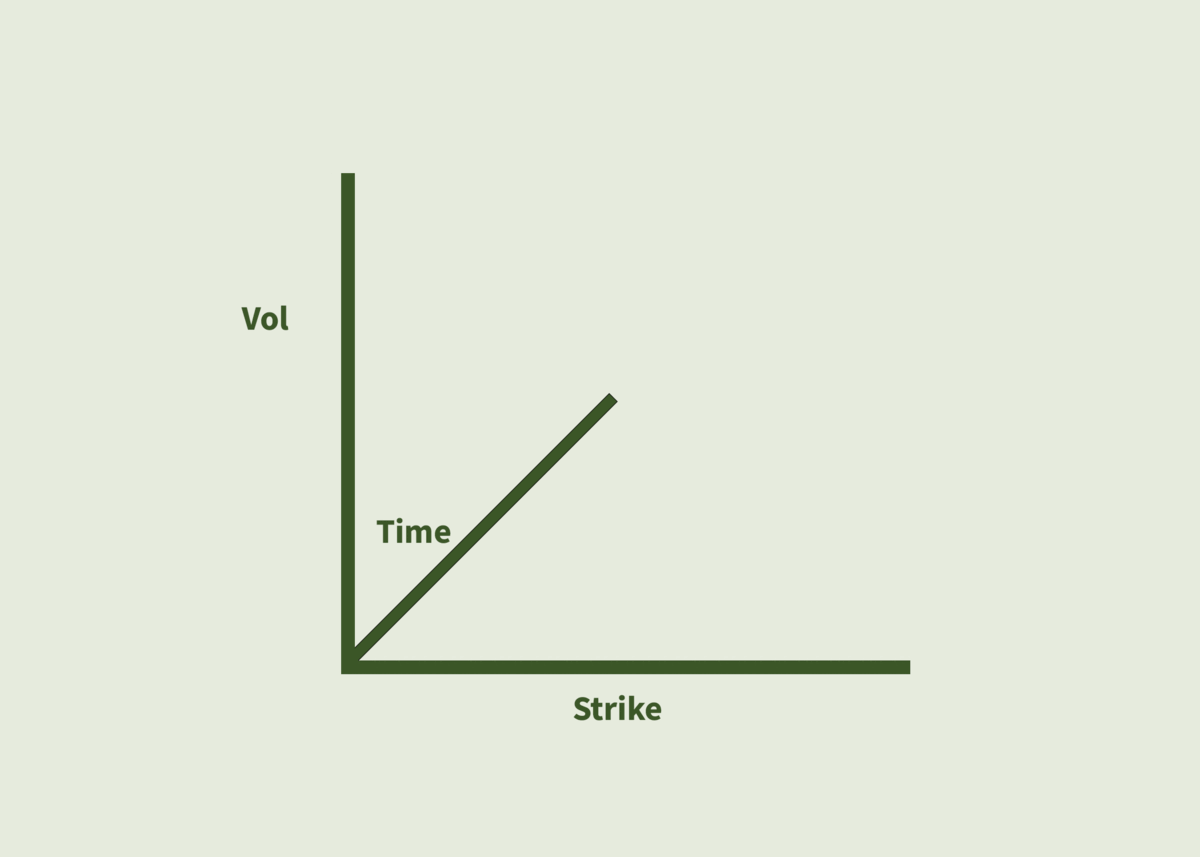
In yesterday’s edition of The Till, we explored the relationship between time and volume. Time is a key component of the options pricing model - volume is not. But time on the clock exists because volume can happen, and there are various ways to adjust for different periods of time when there may be more or less volume, e.g. weekends or holidays.
Volume that deviates significantly from the average is likely to temporarily create price aberrations. We see it with market-on-close orders in equities, as well as out of band prints when a large option order comes in. Thus for pure estimation purposes, using an average equity price (like VWAP) to calculate historical volatility is often a better estimator. As the Till discusses, this will depend on your use case.
When applied to variance more granularly, we can weight the deviation from the mean on individual trades by the respective volume that is trading at that level. Again while that has interesting statistical properties, it’s important to understand how that then maps to a trading strategy with defined strikes and outcomes.
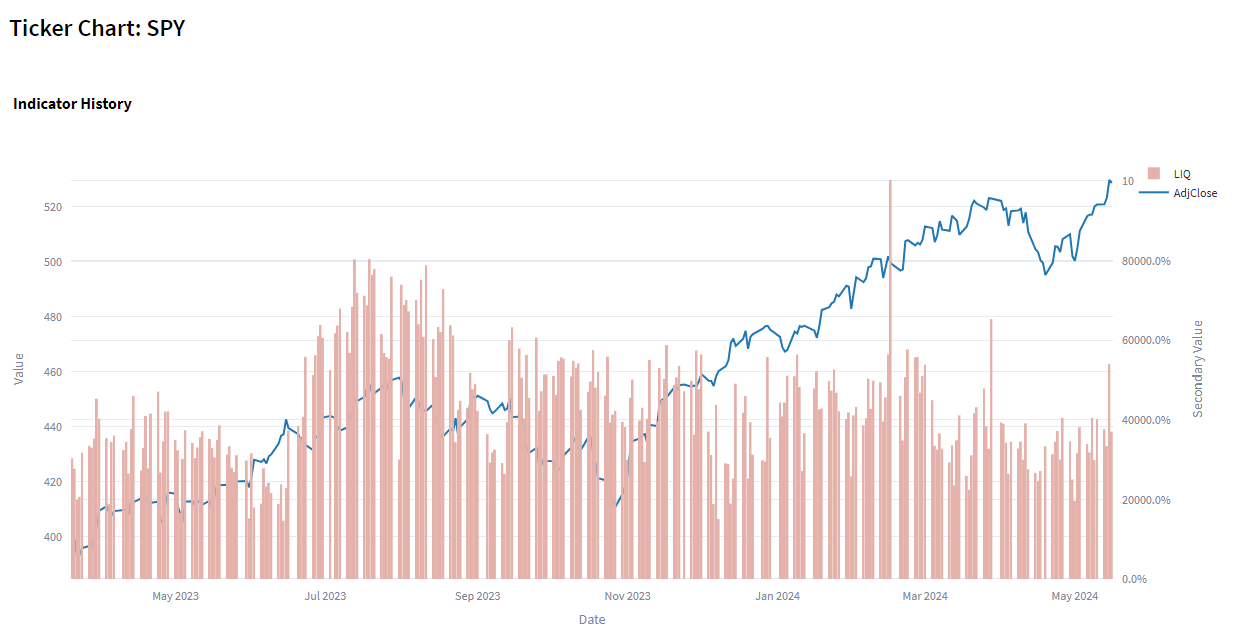
At TheTape.Report, indicators measure the stable values of a 30 and 90 day covered calls (COVC) and cash puts (CSHP), both struck at 30 delta. These are interpolated using the listed strikes across expirations and delta so they can be comparable over time and between issues.
We will be testing the relationship between changes in these indicators compared to relative and absolute volume. Further, what do these volume driven price changes mean for VRP and market efficiency? Said otherwise, how much does big volume move markets and does that get closer or further from a true value?
The names that we’ve chosen for this analysis are SPY and QQQ, alongside commodities like USO and GLD, as they tend to exhibit unique diversification properties in both vol and underlying space. To show the impact across liquidity tiers, I’ve included TSLA (#55) and PEP (#75).
Keep reading with a 7-day free trial
Subscribe to Portfolio Design with TheTape to keep reading this post and get 7 days of free access to the full post archives.