


Splitting Apart StrikeScores
What drives StrikeScores for different issues and time frames

Welcome to the new subscribers.
If you hopped over from The Till, you already know a little bit about my perspective on options and volatility. If not - check it out; the musings of a recovering market maker and options investor.
Portfolio Design focuses on how to implement options strategies. Each week I select an opportunity lens to identify covered call and hedged equity trades. Using tools from TheTape.Report, I’ll discuss the prevailing dynamics in these overlay opportunities.
Paid subscribers not only get the full details of the above, they also get the complete weekly research piece below. This covers topics like the relationships between VRP + Liquidity or how to use the high rate and low vol environment with a Structured Product Toolkit. Today, it’s all about the StrikeScore.
Happy Trading.

Setting the Table:
Bulls were finally given a breather this week as the indices CRUMBLED off their all time highs. -2% for the SPX deserves only the smallest violin, but NDX did take a full 5% off. Do that again and we’re in “correction” territory.
Monday and Tuesday volume was 21% over average, while Wednesday and Thursday was 30/35% over. It’s been a busy week, though index LIQ has faltered a bit. This is mostly driven by spread widths, which were at their widest levels in a month.

Earlier this week on X, I posted that index overwriters are settling for scraps. The 30 day covered call at 30 delta was trading at 57bps. That value has only gone lower, despite market turbulence.


The same dynamic is visible in QQQ, where if we track the 30 day curve yesterday compared to Monday, we see that the 30 delta puts (70D calls) rose twice as much as the 30 delta calls.

VIX and vol are up, but it’s more specifically downside.

Identify:
Strike listings are an important part of strategy implementation. Before you can even have liquidity through volume and spread widths, you need a listed strike.
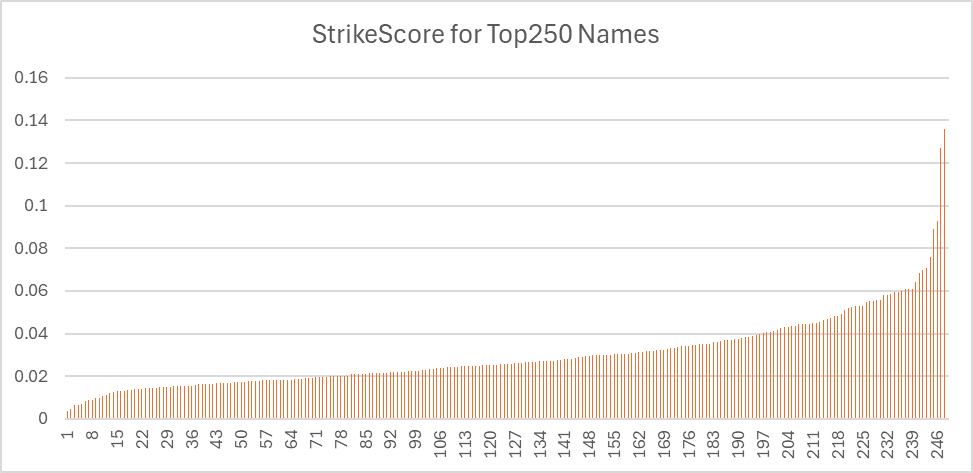
Yesterday in The Till, we introduced a new concept - the StrikeScore. This metric compares strike listings across issues, by determining the average number of deltas away a listed strike sits from a theoretical target.

SPX and SPY had the best scores, with a strike sitting less than half a delta away. QQQ wasn’t far behind, and GLD, NVDA, and MSFT all slipped into the under 1 club. The top 75 issues were all under 2, and the average of the Top250 was about 3 deltas away. The curve accelerates quickly as we go down the list.

Today we’ll dig deeper into the trends here, as well as some of the pricing model reasons behind the score.
Keep reading with a 7-day free trial
Subscribe to Portfolio Design with TheTape to keep reading this post and get 7 days of free access to the full post archives.