Setting the Table:
Price action has been flat this week with the SPX within 15 points of its close on Friday. That’s closer to a daily range than a weekly range. Rates continue to drive the narrative as Powell tempered optimism with promises of more hikes if needed.
Options volumes picked up on yesterday’s sell off, but despite a handful of remaining earnings reporters liquidity has dampened. Volumes are lower and spreads are wider.
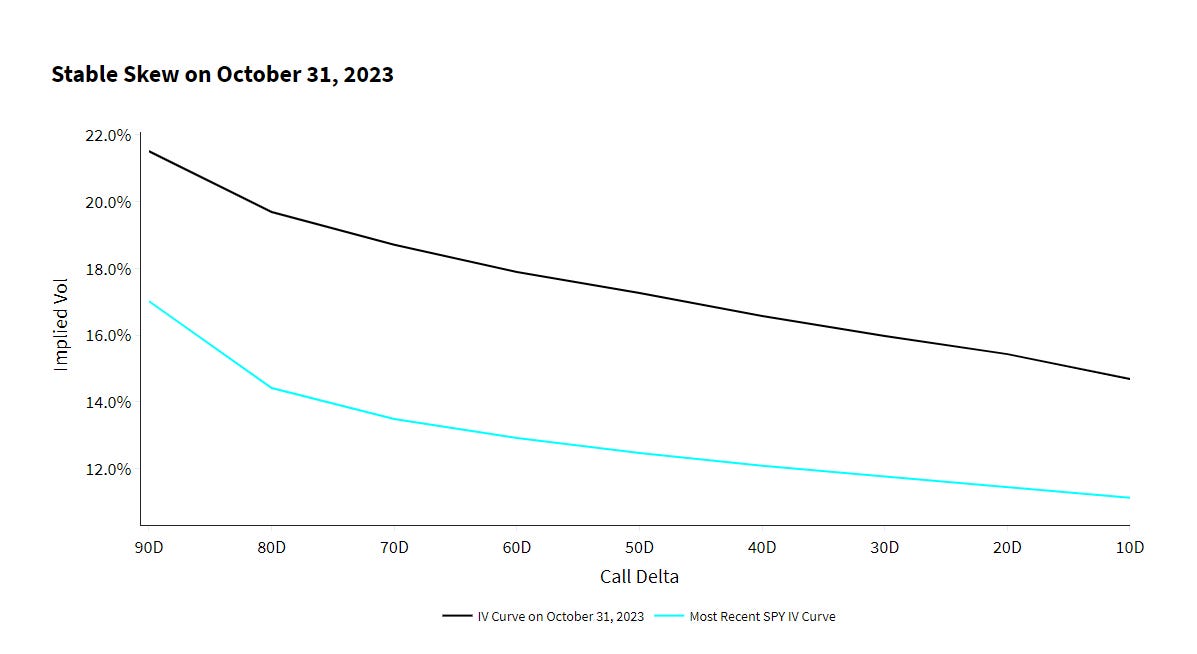
The curve has gotten crushed as a result of this. The difference between a 17.5% ATM vol at 30 days and a 12.5% reading is significant, that’s about 15 points less per day in SPX action.
(Keen observers will note the new colorway. This weekend we’ll be deploying an upgrade to TheTape that includes not only new features for Fixed Delta Spreads, but a whole new color schematic for easier reading and interpretation. Use coupon NEWCOLORS to get 20% off an annual subscription and see for yourself. )
The most bullish sector right now is crypto. Ethereum has popped over $2,000 again on news of Blackrock registering a trust which would be a precursor to filing for an ETF. Bitcoin also rallied alongside other top coins. ETFs mean options, and it would almost certainly bring speculative volume and lots of price movement.
Identify:
One of the most important metrics in an options traders tool kit is the measurement of volatility. Options price movement, and volatility is the statistical description of that movement, variations that are distilled into a single figure.
Strike and Stock Price are the components of the pricing model that are most fixed, there’s almost no room for interpretation.
While Days to Expiration seems like it should be fixed, and usually is, there are certain pricing models that treat market hours differently from non market hours. Should an option with 72 calendar hours on the clock be priced the same on a Monday afternoon versus a Friday afternoon with the weekend included?
Interest rates are arguably the other input that can be traded with options pricing. Rho (interest rate sensitivity) matters for the most liquid names in terms of forward pricing and the risk free rate. The current ATM strike for SPX one year out is 4575, even with spot at 4375 because of that risk free rate. With “hard to borrow” stocks where short selling is more difficult, the rate can be negative, and traders use calls and puts to get that exposure thus creating pricing changes.
Assuming those other variables are either fixed or stay relatively constant, we can focus on price movements in options being related to volatility.
Implied volatility is a reverse engineering of the options pricing model to come up with a pricing input based on the market price of the option.
There are some asterixis with regards to pricing models also, mainly for early exercise. The original Black Scholes model does not account for this (it assumes European options) and assumes distributions are continuous functions. This makes for simpler calculations, but you ultimately get more precision with tree models that probabilistically fork all of the different scenarios at discrete moments in time.
Skew is the indication that volatility is priced differently depending on different strike prices. We mostly talk about “at the money” volatility, but the price of calls and puts away from the current underlying price indicate what volatility is expected to be if stock moves there.
Keep reading with a 7-day free trial
Subscribe to Portfolio Design with TheTape to keep reading this post and get 7 days of free access to the full post archives.


