


To infinity and BYND?
Screening for high volatility covered calls


Covered Calls: Opportunistic
This week’s screener for covered calls focuses on identifying opportunistic trades in shorter time frames. The goal of these screener parameters is to find calls which might be priced higher than usual, and use that as a setup for a single overwrite. Opportunistic overwrites start the filter with options pricing and then evaluate if there are also fundamental reasons to be “long delta”. For the covered call trade to work out, stock needs to stay fairly positive - even large premiums only offset so much downside.
Today’s filter parameters are the following. We limit the screen to Top250 names for liquidity and quality reasons. We’re going to evaluate based on COVC30 and COVC90 to see where 30 and 90 day calls are priced relative to stock. We’ll also look at the IVNetHV to get an idea about where current volatility levels compare to recent activity and VRP.
At the top of the Screener we see GME, AMC, and DJT. I’ll throw these out because of the mimetic frenzy, as a trade in those names requires a slightly different thesis. However if you’re at all bullish, nearly 10% of the stock price can be had - and you still get up to 100% price increase. That’s what 200% vol does in 30 days.
Below we’ll dig into BYND, and the expensive calls there. As always, this doesn’t constitute investment advice, nor is it a recommendation to buy the stock or sell options. This is intended soley as a descriptive example of factors at play. Do your own research or consult with a professional.
BYND
Indicator Readouts:
COVC30: 6.52%
COVC90: 10.69%
HV_CC_30: 80.82%
ATMVol30: 112.28%
ATMVol90: 124.94%
VRP_CC_30: 56.33%
IVNetHV30: 32.46%
Bolly50STD1: -15.7%
The closest expiration date to the COVC30 would be June 21st, and the 9 strike is currently just under the 30 delta target.
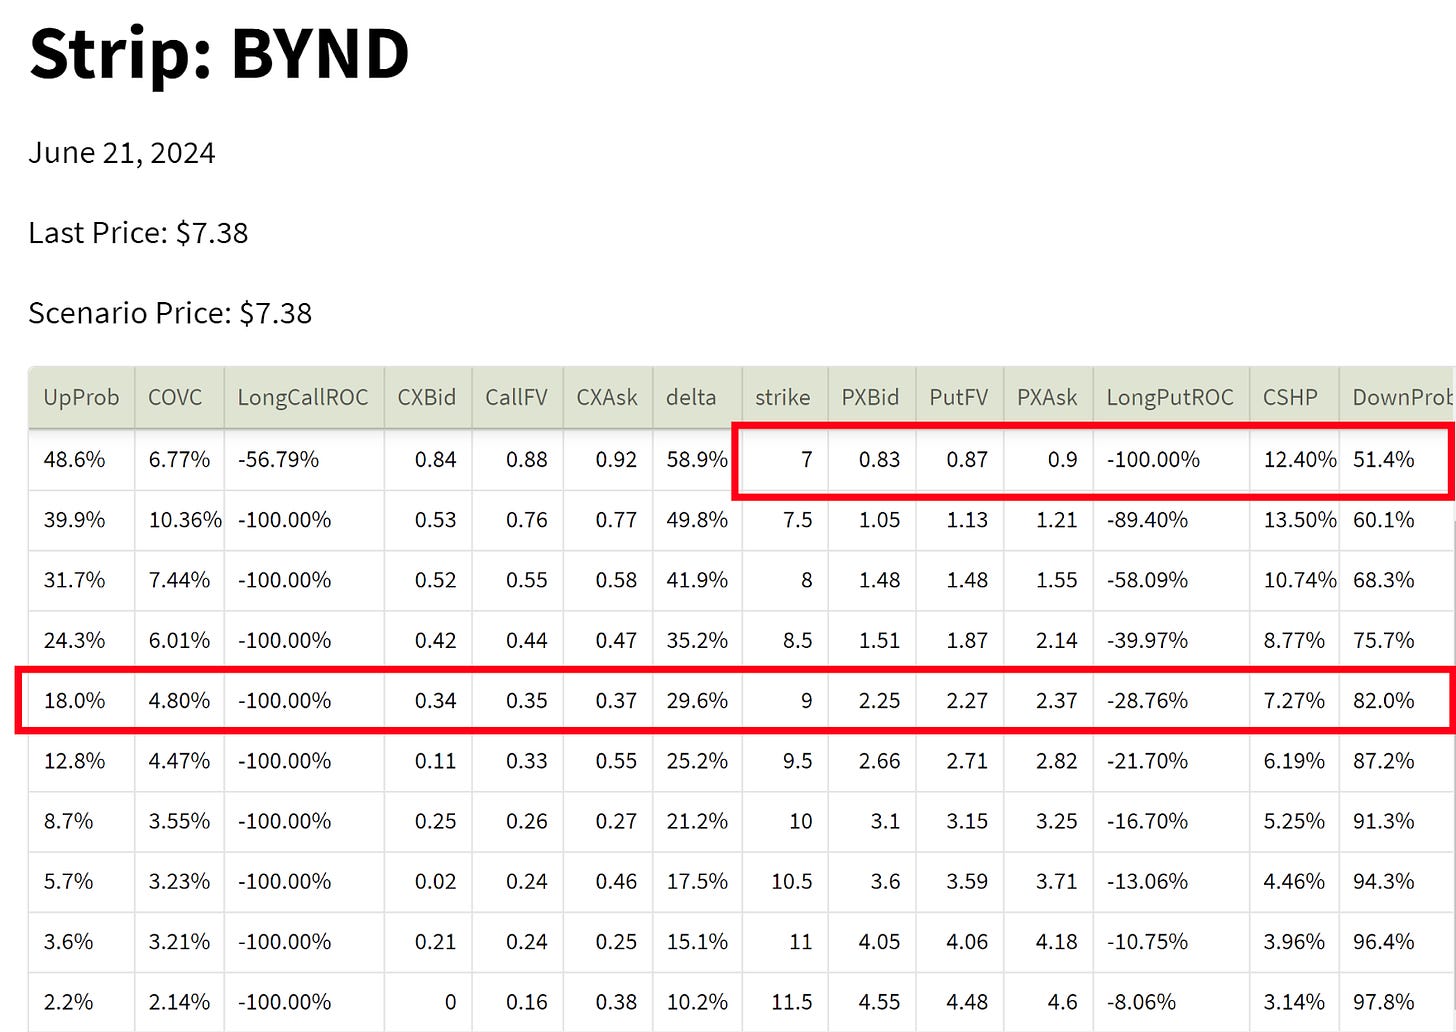
This is currently trading at $0.35 cents, and I highlight the 7 strike for its “DownProb”. This 51% figure estimates that based on the historical volatility of BYND, there’s a 51% chance it goes below 7 in the next month. The 7 strike is important, because that’s the breakeven on the downside.
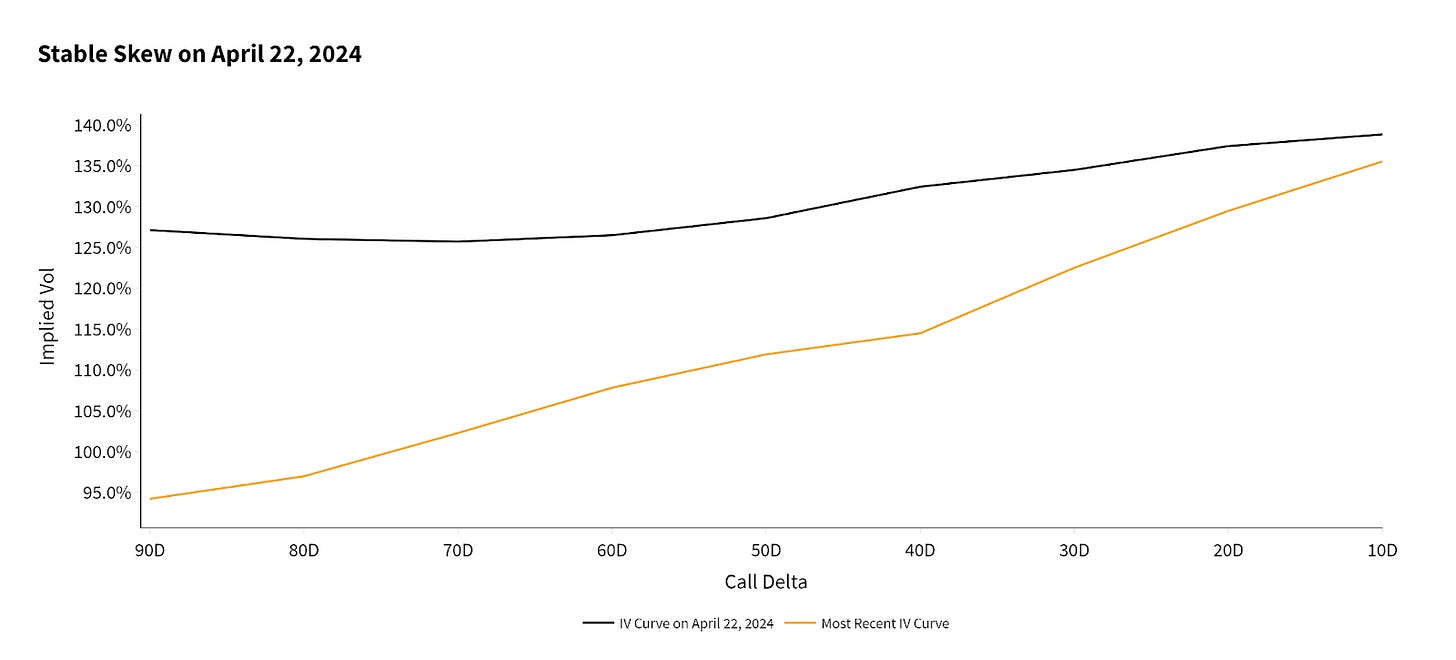
ATMVol is trading over 112%, but historical vol for the last 30 days has only been 80%. This gives 30 points of IVNetHV. VRP is even higher, over 50 points. Implied volatility has come in, but it’s still not as low as historical volatility. We can see this overall drop, but also a significant drop in the put side of the orange curve, giving BYND a distinct “call skew” and making upside calls relatively more expensive than ATM.
The final indicator I’ve included here is the 50 day, 1 standard deviation Bollinger band, to quantify where this is price wise. At -15%, we’re just below the 50 day moving average, right smack in the middle of historical vol range.
We also see below in green, that while implied volatility is fairly erratic, we’re also in the middle of that range.


Start a free trial to see the full screen below.
A subscription to Portfolio Design also includes access to the Screener and all the other tools at TheTape.Report. Build your own portfolio of fundamental and opportunistic overwrites, or work with Harvested Financial to execute a custom strategy.
Keep reading with a 7-day free trial
Subscribe to Portfolio Design with TheTape to keep reading this post and get 7 days of free access to the full post archives.