Setting the Table:
The selling has continued as markets digest the idea of another rate hike and debt ceiling drama generates vacuous headlines. To be fair, this has been the clear message from the Fed all along has been that rates will be higher for longer, it just was heard with much more optimistic ears.
Options markets turned over 48M contracts yesterday, which is above average, but honestly still feels low for a 70 point drop in SPX. Liquidity however has stayed relatively strong with tighter spreads digesting the volume well.
While market watchers have been obsessed about dot plots and every tick in the VIX, the average consumer tends to be on the lagging end of these adjustments. The most stark indicator is the cost of housing, which has risen to over 42% of annual income. It’s not just housing though, car payments and credit card debt has also expanded amidst this tightening cycle.
BONUS: The Chicago Tribune has an editorial out about what Ed Tilly’s departure from the CBOE could mean for the city of Chicago. As the city battles gaping budget holes, the temptation of a transaction tax comes at the same time as the exchange loses a home town hero.
Identify:
While two days of drops is hardly a pattern, this week has firmly shaken away the last of the summer’s pollyanna rally. A few weeks ago we pointed out that VRP had ticked negative in SPY as the historical vol finally woke up. (VRP is the difference between what options markets imply and what actually happens. In SPY we’re used to seeing small positive numbers around 2%.)
As you can see below, ATM vol has picked up quickly, and even as we’re moving around implieds have outpaced realized.
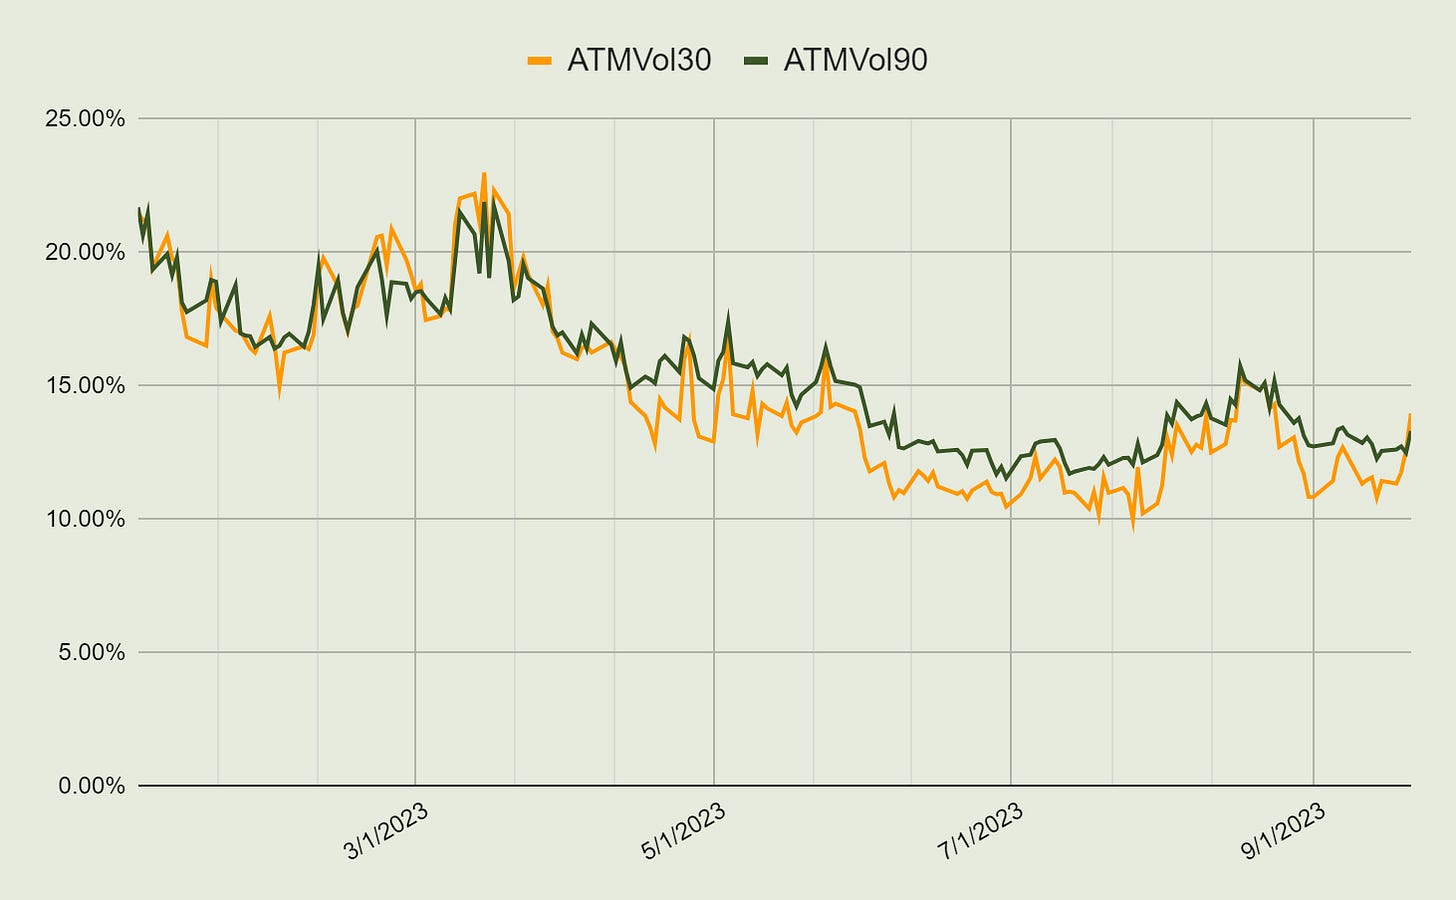
Contextualizing these overall volatility levels, the zoomed in three month graph above looks a lot more benign considering the path we’ve taken year to date. Below is 30 and 90 day volatility tracked over the entire year, and we’re only just starting to see that “backwardation effect” where 1M vol pops over 3M vol.
Typically volatility is slightly higher further out. I wrap my head around this by considering that the near future is relatively knowable, and the further out you go the greater the uncertainty. It’s relatively unusual for markets to price things being tumultuous now and stable later. If things get better later, why go crazy now?
Another way of visualizing the intra month relationship is to look at the VIX term structure. The VIX calculation is more nuanced than just looking at ATM vol, but it is telling a similar story. As of yesterday, the futures price for VIX contracts expiring roughly on 10/18 days away ticked within a hair of those expiring 12/20.
While the back part of the curve is still in relative contango, compare how the 30/90 day relationship looked only a week ago. Both terms are up, but the front month closed the previous 1.5 point gap that existed.
Keep reading with a 7-day free trial
Subscribe to Portfolio Design with TheTape to keep reading this post and get 7 days of free access to the full post archives.


