


Skew for the QQQs
Capturing the Risk Reversal Premium in the Nasdaq 100


Setting the Table:
Equity markets have been choppy this week, mostly driven by China related news. Apple Inc specifically has been the target, as government officials will be banned from using iPhones, which drove a sell off that erased over 10% of the company’s valuation. Couple this with an overall weakening economy, and China woes have been the main driver of price action this week.
Options wise we have seen moderate but not significant volumes. The CBOE continues to analyze the volume and activity in 0DTE options, with their recent study specifically focused on the “tail wagging the dog” effect that these products might be having on the equity markets.
One of the long standing claims about short dated expiries is that they put a lot of additional hedging demands on the market makers and liquidity providers. The theory goes that because of both an increase in overall volume and the greek/risk profile of these derivatives, the resulting equity and equity futures volume is swamped by dealer activity.
While there might be something to be said about short term activity where options flow dominates a small window of volume, overall the options dealer exposure compared to the overall volume of equity futures is miniscule. The CBOE estimates that the delta/gamma exposure created by 0DTE represents only 0.17%-0.40% of underlying volume.
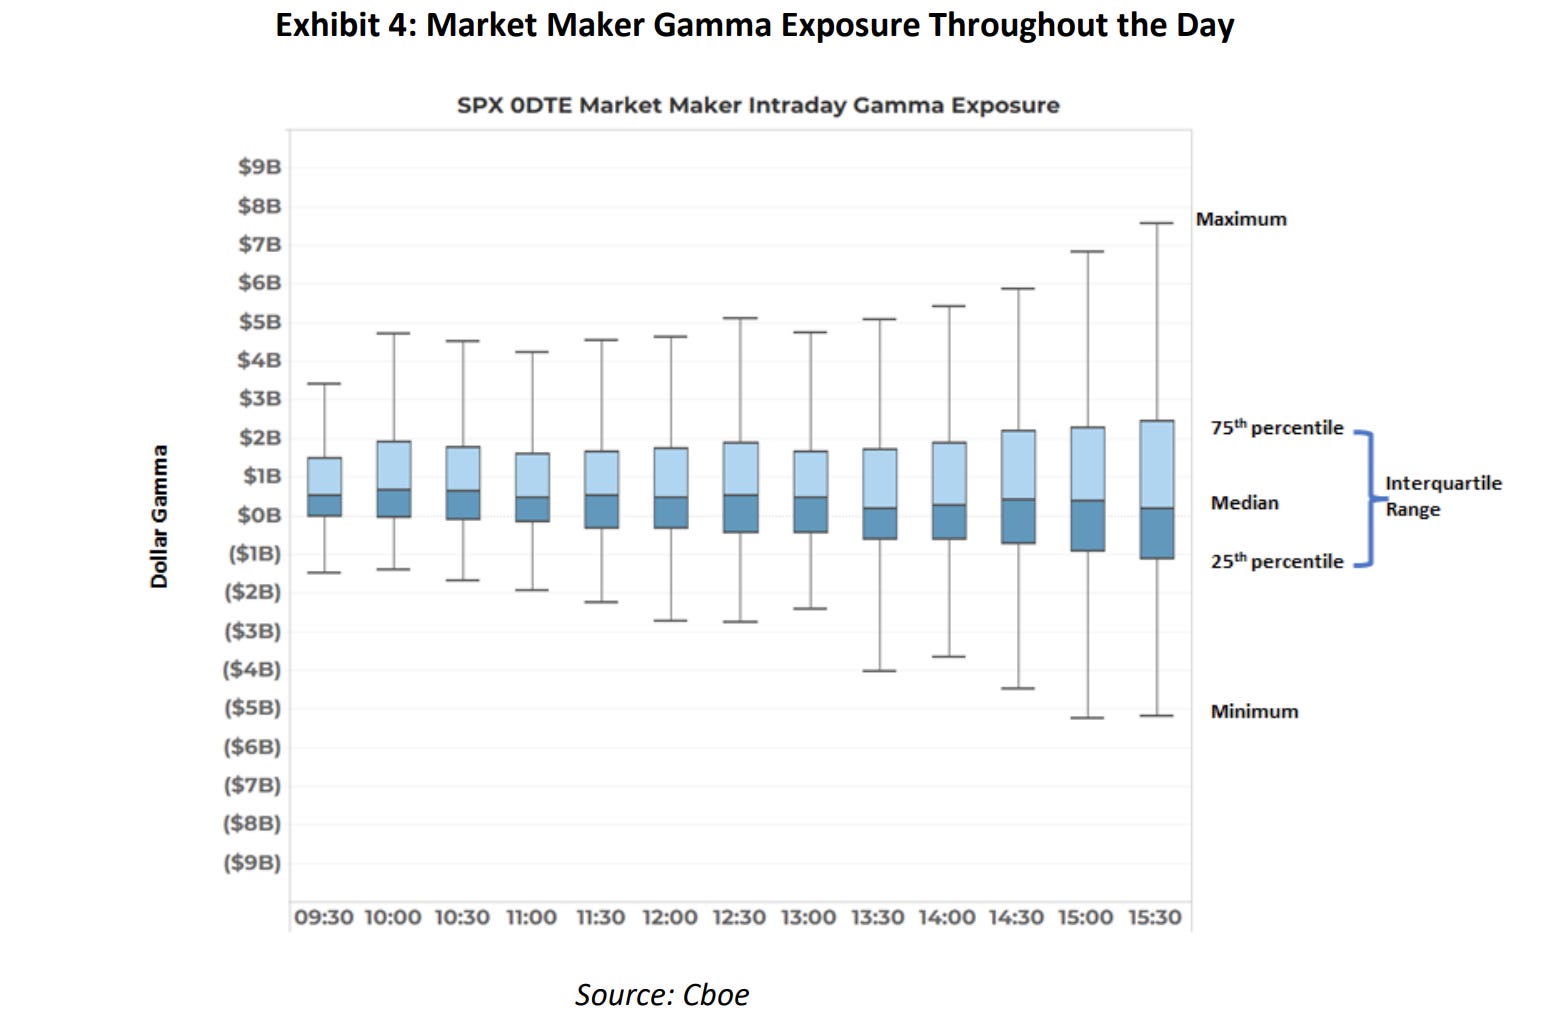
As the chart below shows, the gamma exposure will naturally increase throughout the day. Not only have more contracts accrued, but the dynamics of the pricing model increase the price sensitivity of options as you get closer to the closing bell. The mean gamma exposure is between $170-600M per day, with extremes of $5-8 billion. Those are really big numbers; but the S&P futures trade around $400B a day.

These products continue to be very interesting for both professional and retail use cases. Fortunately much of the fear mongering about the embedded or systemic risks seems to be overblown. But unfortunately for anyone trying to divine market direction from this positioning, there are much bigger flows out there.
Identify:
Despite the recent troubles for AAPL, tech has had a fantastic year, well exemplified by the +40% figure for the NASDAQ year to date. This has been broadly driven by the excitement over artificial intelligence, and is an emotional respite after the beating last year.
While SPX and SPY are broadly similar in terms of liquidity, there is a significant difference between NDX and QQQ. The QQQs are almost 3 times more liquid than the NDX, mostly in fact driven by the tightness of markets. If you want to be able to execute in very large size, the big contracts and high touch liquidity is likely better, but for anything other than institutional use cases, the QQQs will deliver a better experience.


Something to consider when choosing between these two products is the tax implications of either. NDX is an index, and won’t pay dividends. On the other hand, NDX is a Section 1256 contract which benefits from what’s called “60/40” treatment, and gains and losses are split between long and short term. Depending on your use case, tax considerations might outweigh liquidity levels. (Please consult an accountant or tax advisor before making and decisions.)
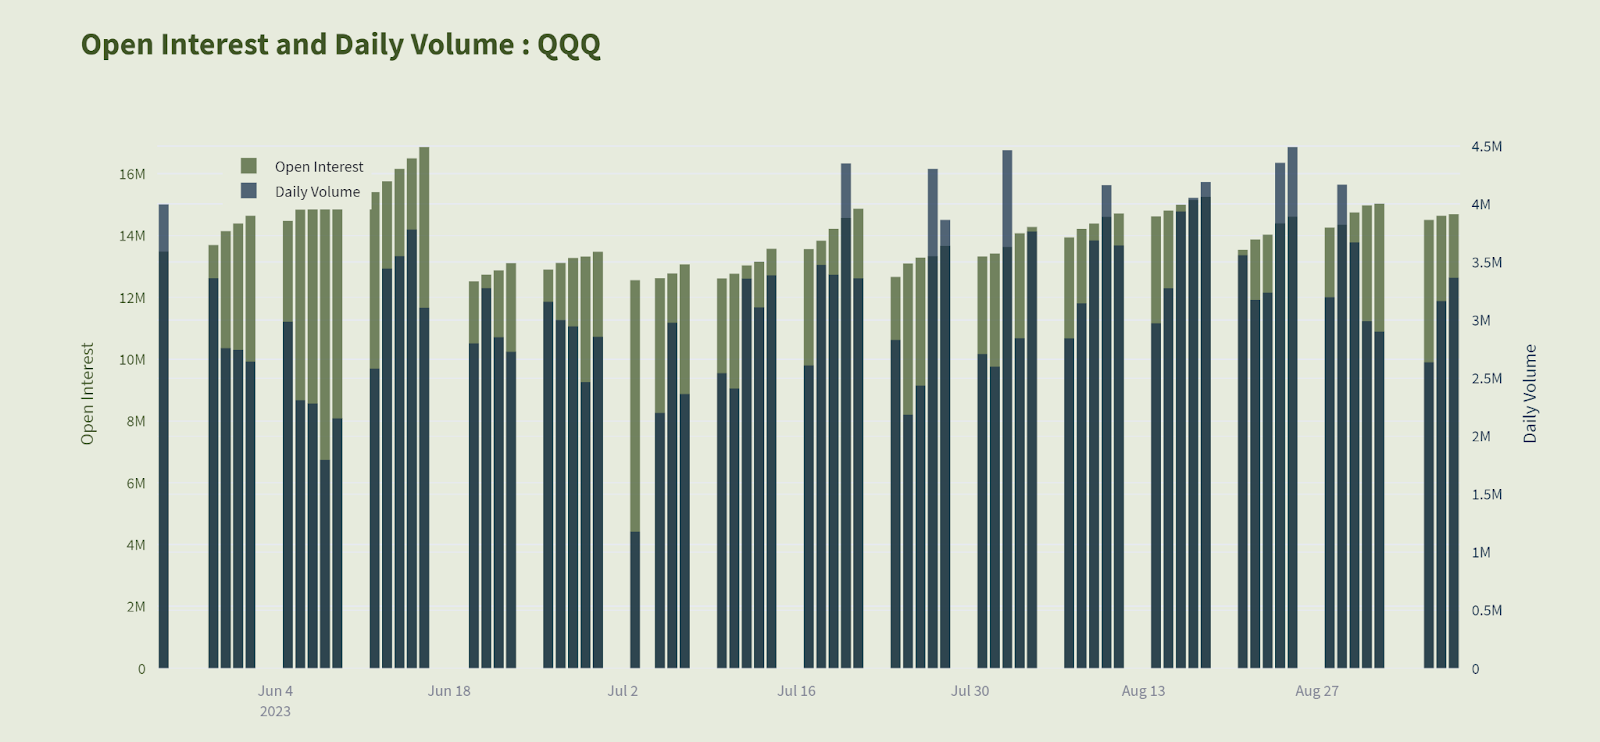
We know volume is robust in the QQQs, but this product alone is regularly trading over 2 million contracts per day. That’s roughly 5% of OCC volume.


While much of this volume (as true of all options classes) is taking place in the short term, the Nasdaq 100 index is an interesting longer term portfolio component for investors who want greater exposure to the technology component, and can stomach the difference in volatility. On a five year timeline the NDX is up 100% compared to 55% for the SPX. On a ten year horizon we’re looking at 328% vs. 141%.


Implied volatility is pricing in a good clip more movement. At the 30 day level the QQQs are roughly 18.1%, while the SPY is only 12.7%, with each about 0.5% higher for 90 day ATM options. Despite trading consistently higher, the “vol of vol” is actually a fraction of a percentage point lower. Vol is higher, but it’s equally consistently priced.


Keep reading with a 7-day free trial
Subscribe to Portfolio Design with TheTape to keep reading this post and get 7 days of free access to the full post archives.