


Hedged Equity: NKLA, T, F
Using higher volatility to craft earnings protection


Setting the Table:
Indices are rising, and if you look really closely, so is volatility. Not much has changed in 30 day skew structure, but the 10 day curves are higher. QQQ more so than SPY, where the next week of earnings should introduce slightly more chop.

Basically we’re up - no shape change, just broadly ATM vols of 20% not 16%.
Earnings introduces chop on an individual level, that might percolate out to the rest of the market. AAPL for example has 8-10% points of earnings vol for next weeks earnings expo. This is the market expecting dispersion - higher component volatility compared to average volatility (i.e. the index). Below is the DSPX which measures this predicted dispersion at 30 days.

On an interesting note for market structure - the CBOE announced the listing of variance futures. This brings a product that has long existed for institutional investors to manage risk onto a centrally cleared venue.
Ethereum ETFs also begin trading today. They will probably hit the same snag as the Bitcoin ETFs for options listing however.
Earnings always generates a lot of options activity. For an individual name there is no more predictable cycle, with volumes 5-10x in the days surrounding the event. Higher expected vol isn’t always a good thing if you’re holding a long term position in the equity.
Trading the event vol is a difficult game, but using this vol as a time to hedge a long term investment is impactful. You get a little bit of movement around the current levels, but buffer most of a bad or even extreme case.
Today we’ll look at hedged equity opportunities heading into earnings. Our lens is momentum, so these will also be names that has seen strong - or not - recent performance, inspiring additional protection around an event.
Both of the examples today show that a GULL in the short term looks a lot like a collar - providing equal upside/downside tradeoffs.
You can adjust the downside put to get 50% more upside in exchange for accepting tail risk at roughly 2 straddles away.


At Portfolio Design, we track opportunities through four different lenses: Volatility (VRP, IVNetHV), Liquidity (LIQ), Momentum/Mean Reversion (Bollinger) and Dividends. Each of these filters represents a different approach to investing, and can be used independently or in concert.
With these frameworks in place, follow along here twice a week as we dissect what the screens are telling us for Covered Call and Hedged Equity structures. Identify both short term trading and longer term investment opportunities. Free subscribers get a taste with “YIKES” and paid subscribers get analysis on the details of these opportunities, along with the full screener results.
Data comes from TheTape.Report where users can build their own screens and access a full suite of options indicators.
Yikes: NKLA

NKLA tops the charts with the GULL30 reading of 37.4% , as ATMVol30 sits at a cool 154%. Stock split 1:30 last month, so there’s no point in talking about how far down we are here.
But a reinvigorated stock handle means we actually have options to protect with again. Earnings are August 9th, and we have dollar strikes to play with.
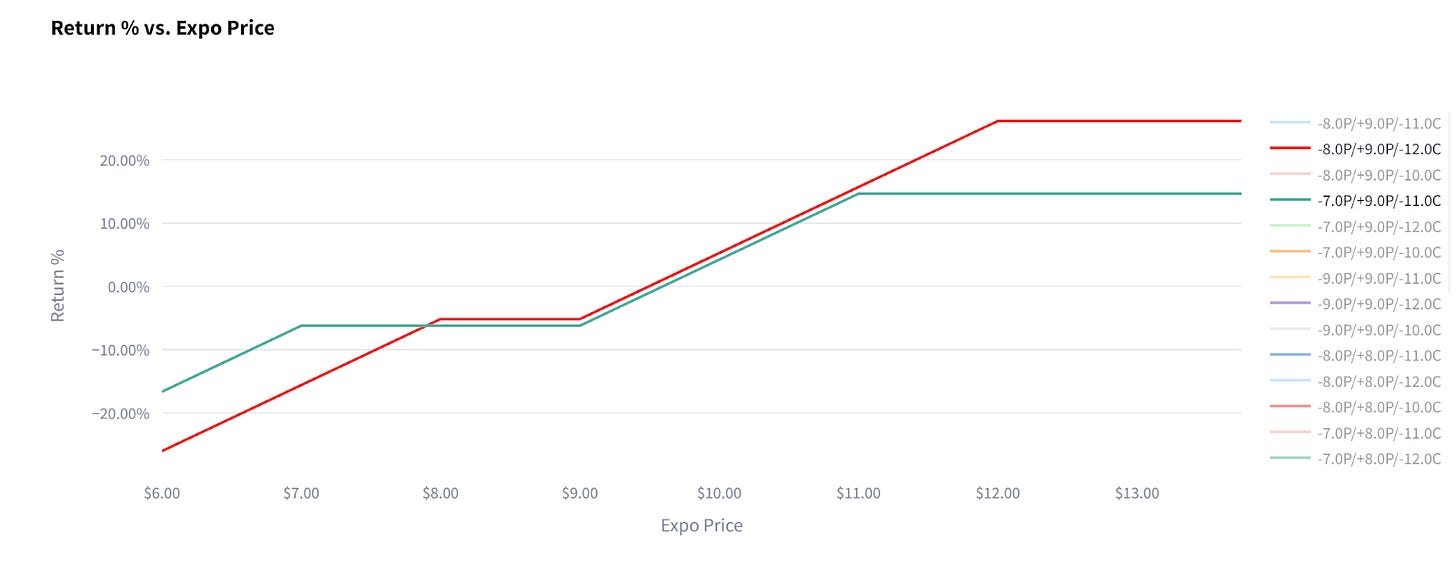
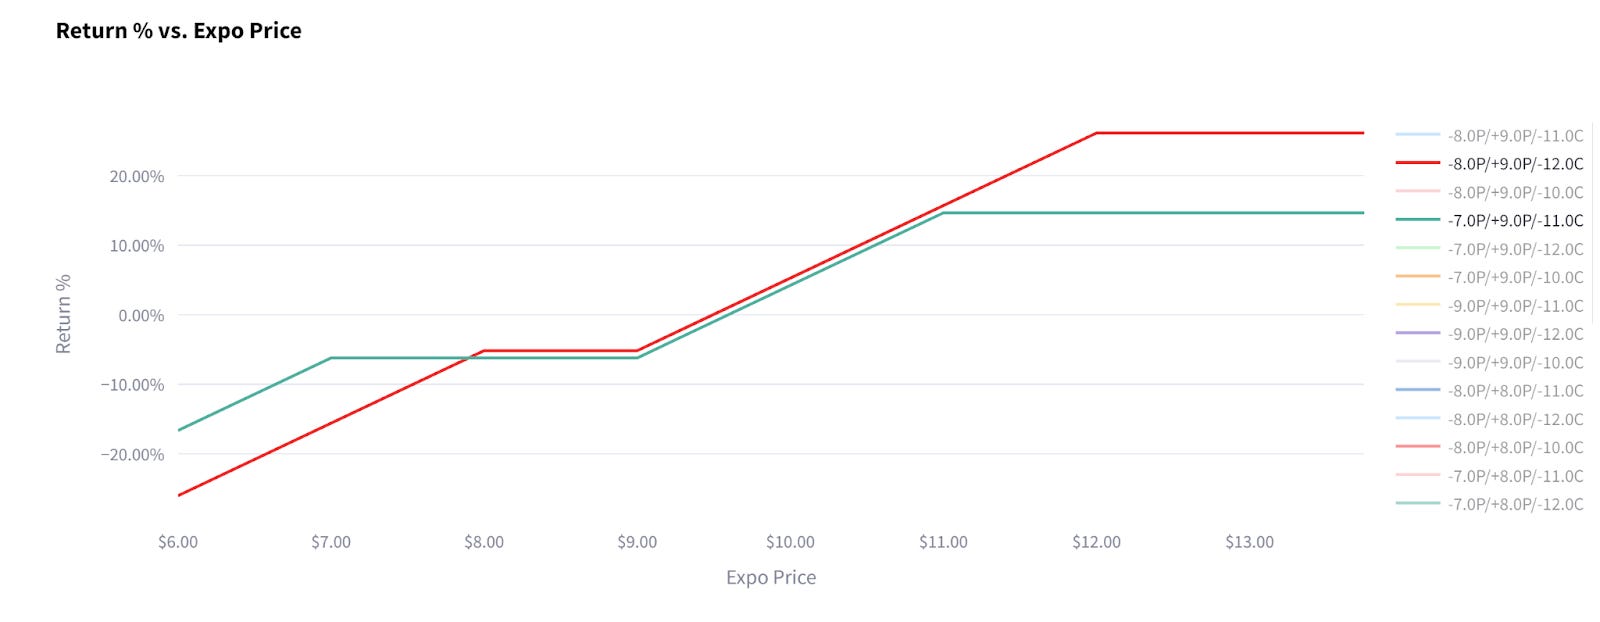
Speaking in percentage terms, there’s a pretty wide jump between them. The chart below shows the shift between the 7/9/11 structure (more protection, less upside) and the 8/9/12 (double the upside, 10% extra downside).
Realistically, most of this volume is probably speculative, and thinking about this spreads in simple dollar terms.
Keep reading with a 7-day free trial
Subscribe to Portfolio Design with TheTape to keep reading this post and get 7 days of free access to the full post archives.