


Covered Calls - SPY, PLTR, AAPL
Seeking liquidity in times of volatility


Setting the Table:
The market has been waiting on rate cuts since the tightening cycle began - but they don’t seem to be coming in the way it was expected. After last weeks panic and calls for an emergency 75bps cut, equities were green on the week, and steady as they focus on Wednesday’s CPI data.
With earnings in the rear view, expect the next two days to be particularly calm. It’s a good time to be patient about trading setups, as recalibrations post data releases will be swift.
If you are looking for a trade this week, calibrate your horizon appropriately. Starting a 30 day leg now is different than starting a 3 or 10 day trade. The short term trade is about the “event”, whereas the medium term trade gets paid medium term prices with a heightened risk of a short term path adjustment.
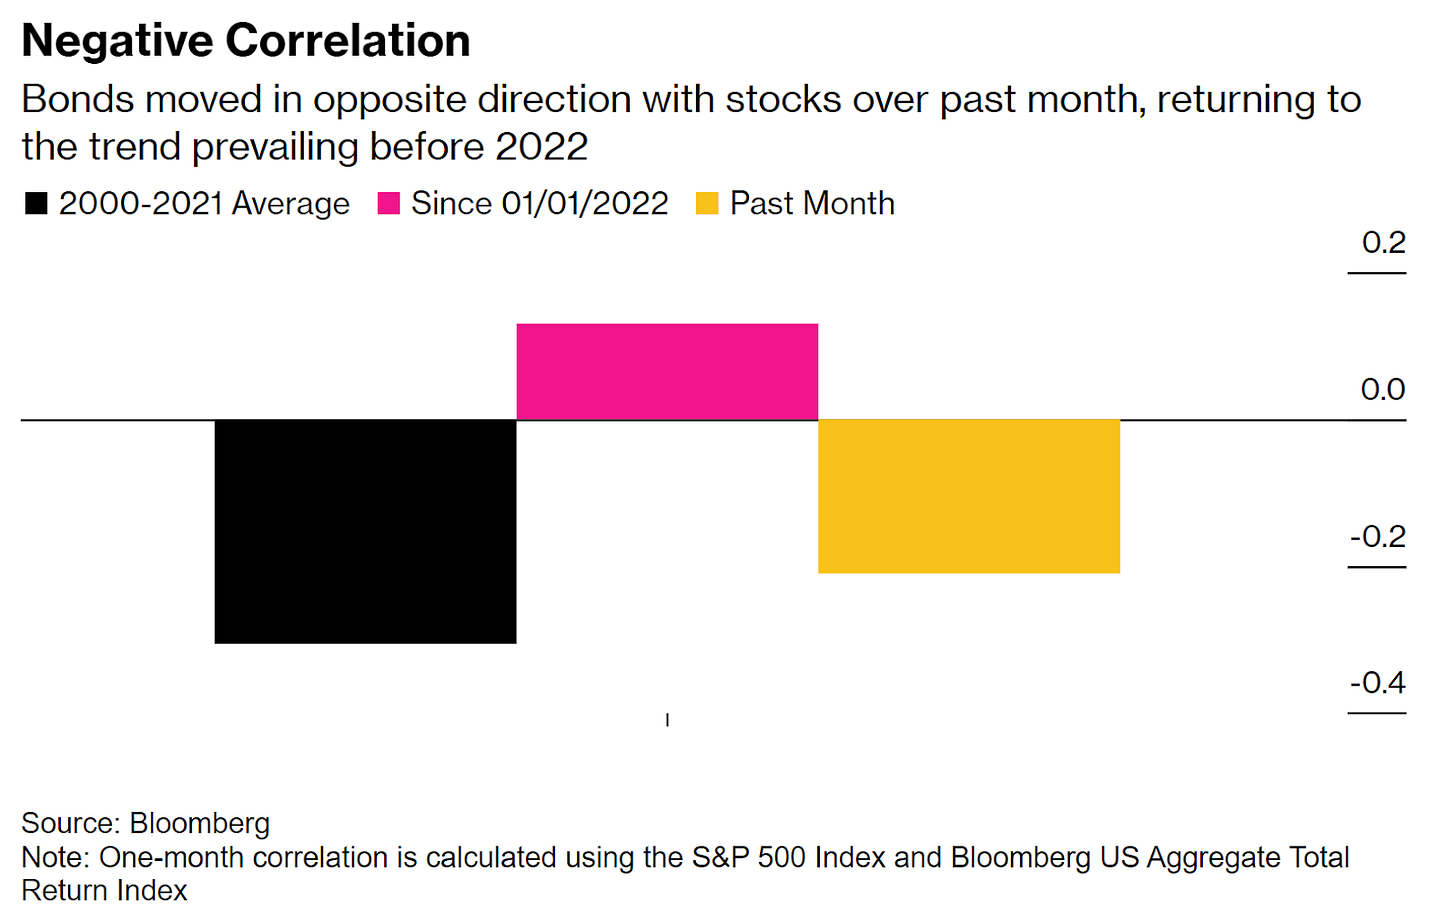
In a sign that we’re tending back towards “normal” the relationships between equities and bonds have returned to their prior dynamic. The below chart from Bloomberg shows how the positive correlation of 2022-mid 2024 which hurt many classic 60/40 investors has reverted.
Markets are a collection of people, and the path and dynamic matters as much - if not more - than fundamentals. After spending over a year shrugging off non-confirming datapoints and climbing a wall of worry, last weeks crack shattered all illusions. From the Wall Street Journal -
“The rose-tinted spectacles are gone, and that means the market can’t simply shrug off bad news, as it did earlier this year. At the same time, the perception that we’re on the cusp between a hard and a soft landing means investors are more likely to overreact to data…”
It’s not how the market reacts - it’s how investors react. And the pollyanna veil has been lifted for this next round of monetary adjustments.
With that in mind - this week we use the lens of liquidity as our filter for overlay opportunities. Liquidity is as much about market efficiency as it is about market widths. Well priced volatility curves (and therefore indicators like COVC or GULL) offer a fair trade-off. Any given trade will only have one path or outcome, but the range of those over time will conform well to expectations.

Are you thinking about a new trading strategy?
Try one of our personalized workshops to review your portfolio and build out a custom trading plan. Learn how to use indicators to develop a consistent opportunity identification system.
Reach out today to schedule 1:1 strategy development. Starting at only $250/session.
Yikes: SPY

Index liquidity has plummeted during this market snap. While the worst was Friday August 2, the past week has been fully 35% below the recent moving average. Markets are about twice as wide, and volumes are sitting slightly below their yearly average.

That’s still an incredible fill in SPY! These are mostly 2-3 cents wide in the front and ATM months. 0.15% wide is still a taker’s market. The standard deviation of 30 day VRP is about 10x that.
In addition to the macro considerations about inflation, Jackson Hole, etc. another reason to give pause on a trade here is how negative that VRP figure is compared to the current ATMVol. We just had historical vol that was 2 clicks higher than what we’re currently pricing going forward(IVNetHV), and -7% VRP is 3x the average in this name, meaning a lot of shorts got shaken recently. Yet 30 Day ATM Vol is still only 16%...
Looking at the pricing of covered calls, while the COVC30 hit as high as 1.26% of stock, it crumbled back fairly quickly compared to VRP. Part of this is structural to how the indicators are created (COVC30 is a snapshot, while VRP is a rolling 30 day movement history) but if you’re thinking of selling that call, it’s worth asking the question if you’re still collecting enough premium in this environment.


Keep reading with a 7-day free trial
Subscribe to Portfolio Design with TheTape to keep reading this post and get 7 days of free access to the full post archives.