


Covered Calls: RILY, AGNC, and VZ
Dividend Screener Results: July 1st, 2024


Setting the Table:
Welcome to the third quarter of 2024. The SPX has risen 15% this year and the NDX is up 19%. (If you’re looking for a good article about what happens next - check out Sharpe Two.)
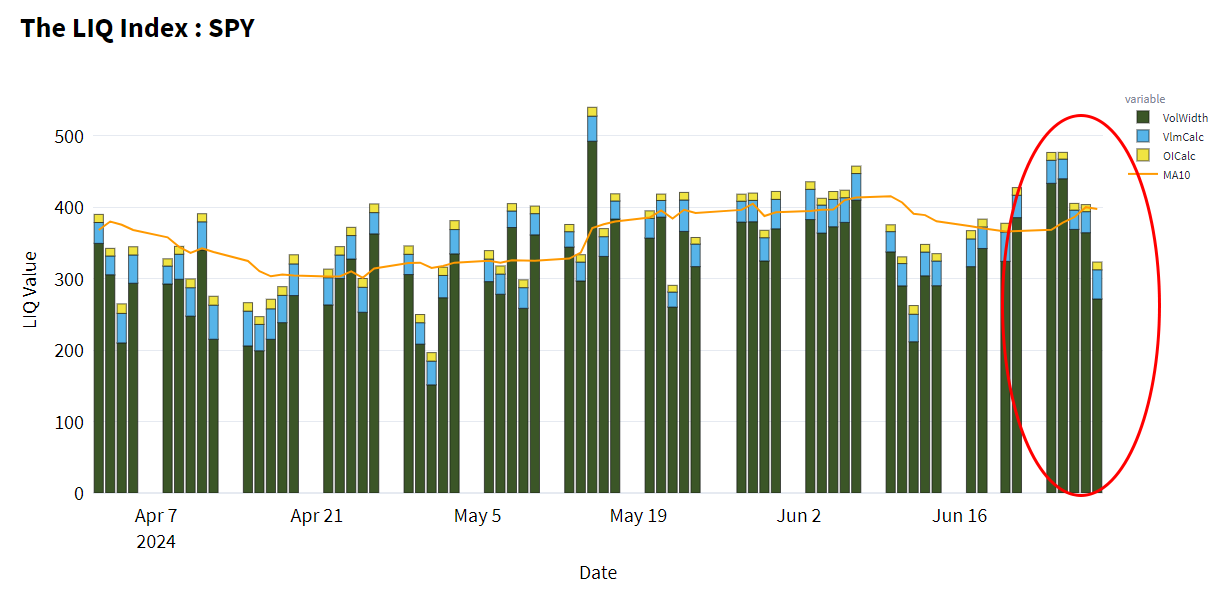
While implied volatility has flatlined, throughout last week we saw fairly robust liquidity - until Friday. The widening out into the quarter end is not particularly surprising, especially as we see a calendar pock marked by holidays.

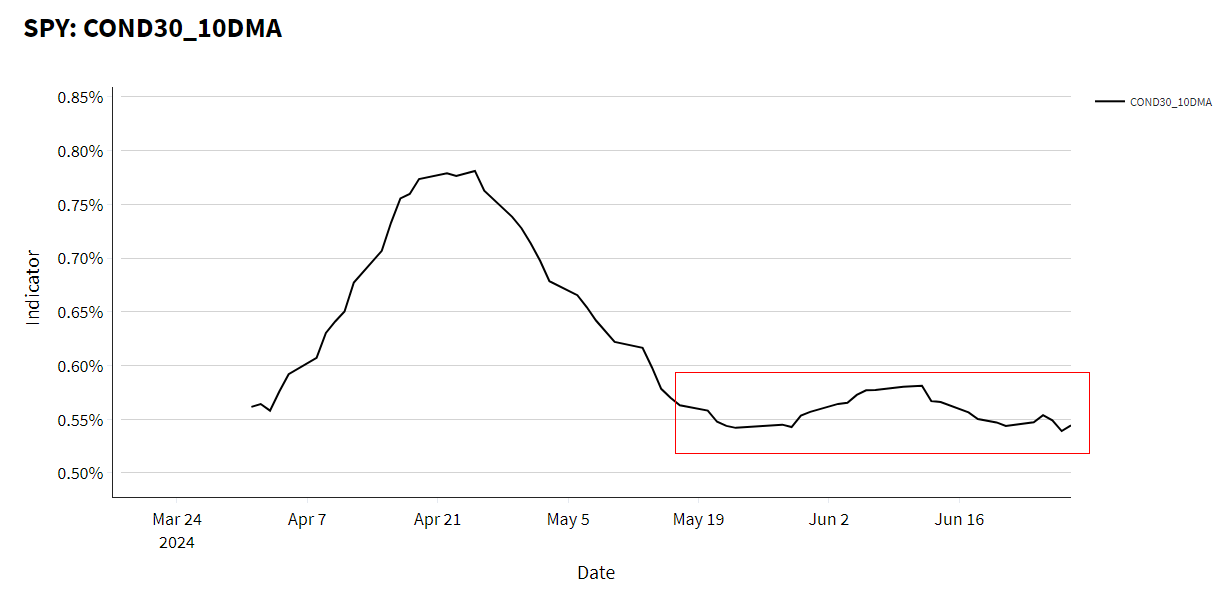
Viewed through the lens of the Condor (COND30) structure - volatility has barely budged in the last month and a half.
This week in Portfolio Design, we’re using the lens of our Dividend Screener. The objective here is to identify names which produce cash flows but also have attractive options structures for Covered Call and Hedged Equity trades.
We use the following columns in our screen: LIQ, COVC30, HV_CC_30, ATMVol30, VRP_CC_30, IVnetHV30, DivYield%, and Bolly100STD1. Find all the definitions here. We also limit this to only LIQ250 names.

At Portfolio Design, we track opportunities through four different lenses: Volatility (VRP, IVNetHV), Liquidity (LIQ), Momentum/Mean Reversion (Bollinger) and Dividends. Each of these filters represents a different approach to investing, and can be used independently or in concert.
With these frameworks in place, follow along here twice a week as we dissect what the screens are telling us for Covered Call and Hedged Equity structures. Identify both short term trading and longer term investment opportunities. Free subscribers get a taste with “YIKES” and paid subscribers get analysis on the details of these opportunities, along with the full screener results.
Data comes from TheTape.Report where users can build their own screens and access a full suite of options indicators.
Yikes: RILY

The B. Riley company has had a tumultuous 2024. While only trading about 10% below their level 6 months ago, we’re less than a quarter the high of 2 years ago, and half of the May levels.
This is the highest implied volatility level of today’s screen, which combined with a 100 day Bollinger reading of -104 starts to send alert flags up.
While we might be attracted by a dividend yield of 13% (#3 highest), the stock price action calls into question whether that’s sustainable.
The IVnetHV figure also looks appealing, but that VRP figure is rather slim for a 93 vol stock.
Keep reading with a 7-day free trial
Subscribe to Portfolio Design with TheTape to keep reading this post and get 7 days of free access to the full post archives.