


Choose When You Fly
Parameters to time entries significantly improve COND returns


Setting the Table:
Equity markets have broadly sold off this week and Friday’s early action seems no different. The 10 Year Treasury yield officially hit 5% and Powell came out highlighting that inflation is still too high and growth might have to take more of a hit. We’re not out of the woods yet.
Options markets picked up activity and saw almost 50M contracts trade hands yesterday. This has partly been driven by ODTE trading, but there has been much more breadth than when we were doing lower volumes. Broad market liquidity has been stable, if not exceptional.

What’s going on in US equity liquidity? BMLL published highlights of their monthly report tracking orderflow and unfortunately it’s trending one direction - down. While gross volume for retail is down (blue line) as a percentage of overall volume they’re actually increasing (red line) which suggests institutions are pulling back even further.

via TABBForum


Identify:
While the market has made some bull runs, and some bear runs, in the last 2.5 years we’re essentially flat in SPX land. Month to date in October we’re within 5 points of flat. SPX ATM 30 day implied volatility is expecting about 17% moves in a year. To normalize that to a week long period, we’d divide by the square root of (252 trading days in a year) / (5 trading days in a week). That gets us expected weekly moves of roughly 2.5%. 100 point moves, not 5 point moves.
If the market isn’t moving, and volatility is high, one of the more attractive market neutral strategies is condors, or iron condors. In this approach they’re typically sold, but they can of course be bought too in times where volatility is cheap.
If straddles are an intuitive short hand for how much a stock is expected to move, condors are one of the best risk managed ways to take advantage of high or low volatility risk premium. By selling spreads losses are capped, and the setup often targets out of the money options.

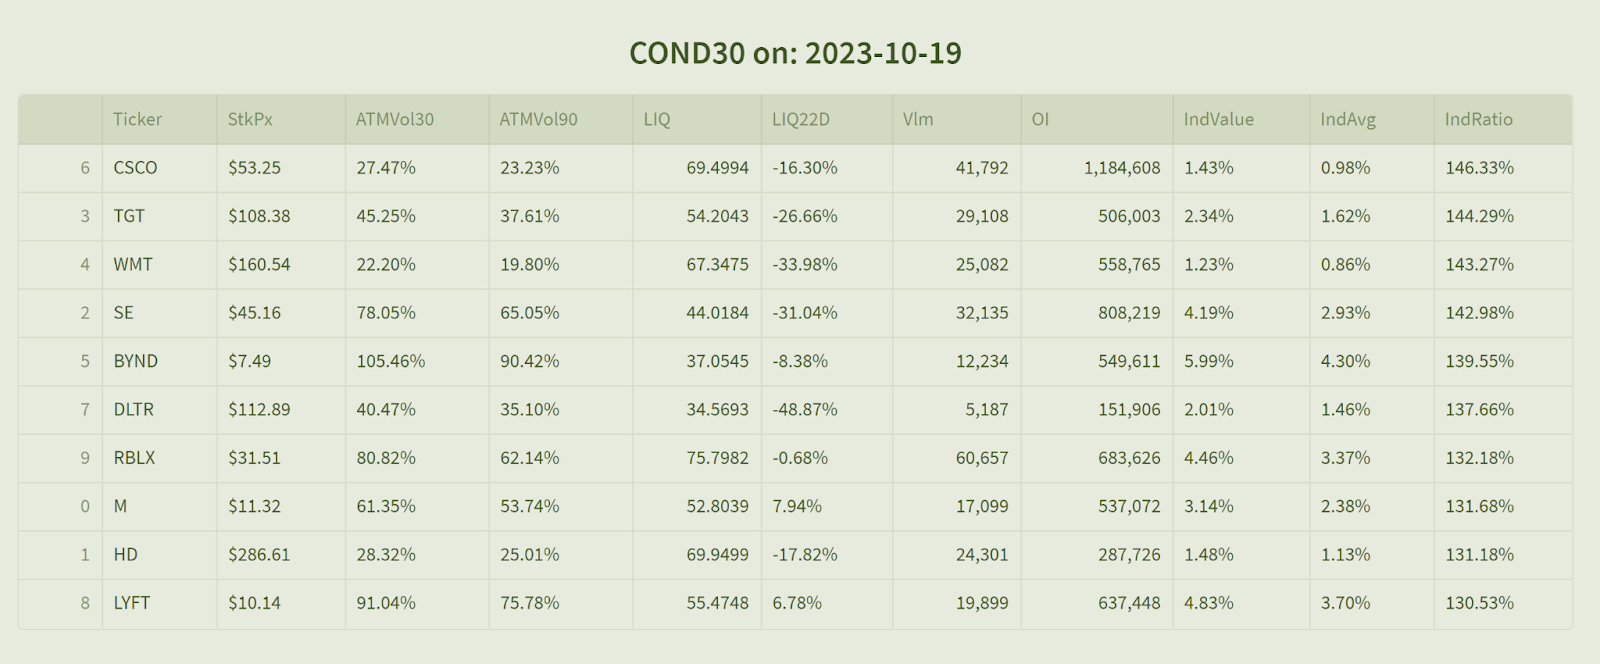
TheTape thinks about CNDR levels as a theoretical construct. Rather than tracking the specific performance of a strategy, we track what the overall levels are for a fixed duration. COND30 looks at the 20/5 delta put and call spreads 30 days out, and COND90 does the same at 90 days out.
The conceptual difference here is that by tracking a stable duration and delta level, we can see how the pricing of this strategy changes over time. To practically connect this to a trading strategy, COND30/90 can be used to time rolls or entry points.
The Xtreme Indicators report also looks at divergences in COND (and other indicators) to highlight when condor pricing might be at a relative extreme. As of yesterday’s close we see names like Cisco, Target and Walmart all trading about 140% of their average over the past 30 days. Whereas WMT and CSCO previously had index like readings under 1%, they’re now over 40% more expensive. This goes along with the jump that you see in those relative implied vols. COND moving more than ATM vol tends to indicate that tails are getting more expensive.


Keep reading with a 7-day free trial
Subscribe to Portfolio Design with TheTape to keep reading this post and get 7 days of free access to the full post archives.