


Bouncing Between Bands
Mean reversion strategies in equity and volatility space


Setting the Table:
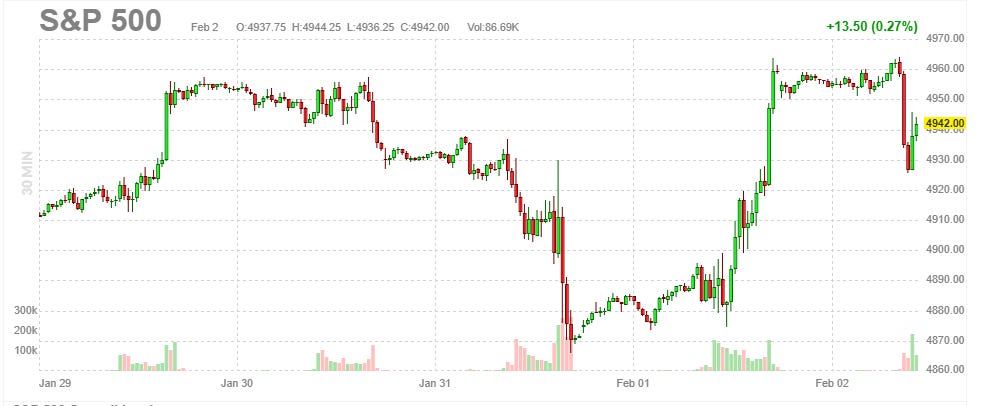
Push and pull and end up in the same place. The chart from this week feels like a chart from 2022. Moves over 1% in either direction, with very little happening at the end. If you’ve heard me say that before, you’ll probably feel comfortable with a short condor strategy.

This morning we have futures up another 30 bps (here comes SPX 5000!) on hopes that a weak job report will encourage further easing. That and the fact that AMZN is killing it.
A curious example splashed into our liquidity pool today, with the infamous DWAC SPAC landing in the Top 250. Volumes have been robust there - trading just under a million contracts last month. We can see how volume has exploded (red bars), but that makes it fairly difficult to calculate much history for indicators, because there were hardly any markets previously.

The monthly expiration has good liquidity now, but old strike listings were much scarcer and there were no 20/5 delta strikes to calculate the COND for example, which is why we see a bunch of 0 values.

It’s a good reminder how relative liquidity really is. The reason we can only calculate the top 250 names, is because there aren’t really strike listings that allow for the granularity these indicators require.
When something explodes onto the scene with big volume, it usually means something material has changed. So the fact that we don’t have indicator values previously matters less, because they represent a different trading paradigm.
DWAC is now an interesting issue to pay attention to, but even if I could create a 30 day Condor from 2 months ago, it wouldn’t have a lot of bearing on the trading today.


Identify:
Reversion to the mean isn’t just your experience asking ChatGPT complicated questions, it’s a statistical property of random variables. The further a stochastic process deviates from its average, the higher the probability that the next and future outputs will deviate less far, i.e. closer to the mean.
This sounds like it violates the Gambler’s Fallacy. You’re not “due” black just because it’s been three reds in a row, each spin is an independent event. The statistical concept here has to do with probability density functions - the more you deviate, a greater proportion of the distribution sits closer to the mean than you do as the function increases continuously.
The mean of course will constantly be changing and reflective of the daily pushes and pulls. This is why moving averages of different time dimensions provide various shades of signal.
Simply put, technical indicators describe the history of stock price. Like any tool, it can get stretched to the imagination’s possibilities, but moving averages and standard deviations are nice statistical methods for describing the past and have mean reverting properties.
My belief is that in the short term the market is dominated by marginal flows of buyers and sellers. This pushes price around because of imbalances that can last a material amount of time. “The market can stay irrational longer than you can stay liquid.”
However, in the longer term both volatility and equity markets become Charlie Munger's weighing machine. A useful predictor of that value can therefore be a net of all the imbalances - the moving average.
It’s very important to note here, as time progresses the mean is a moving target - but your buys and sells are at fixed levels. That’s part of the catch.
Keep reading with a 7-day free trial
Subscribe to Portfolio Design with TheTape to keep reading this post and get 7 days of free access to the full post archives.